Python Scripts with Notebook Features
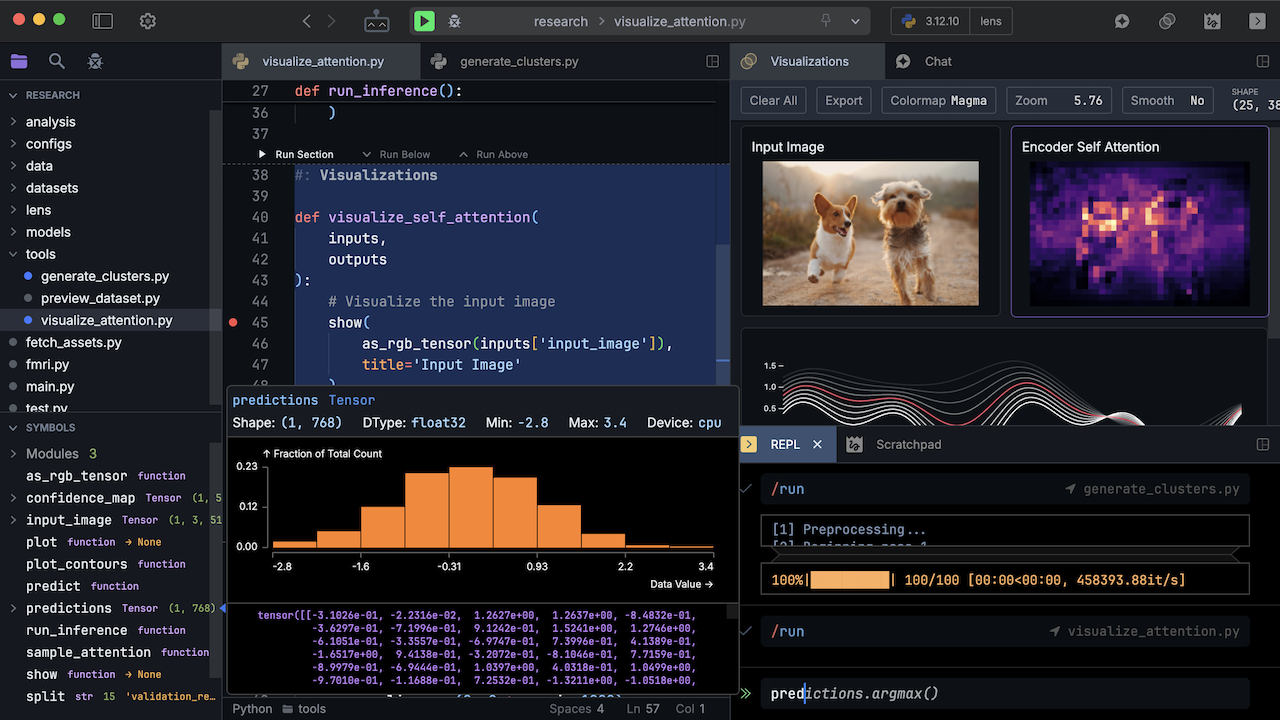
Scripton is a new kind of Python development environment that brings features like built-in visualizations, UIs, and interactive execution to regular .py scripts.
Visualize within the IDE
Run your scripts and view your plots and visualizations right within the IDE.
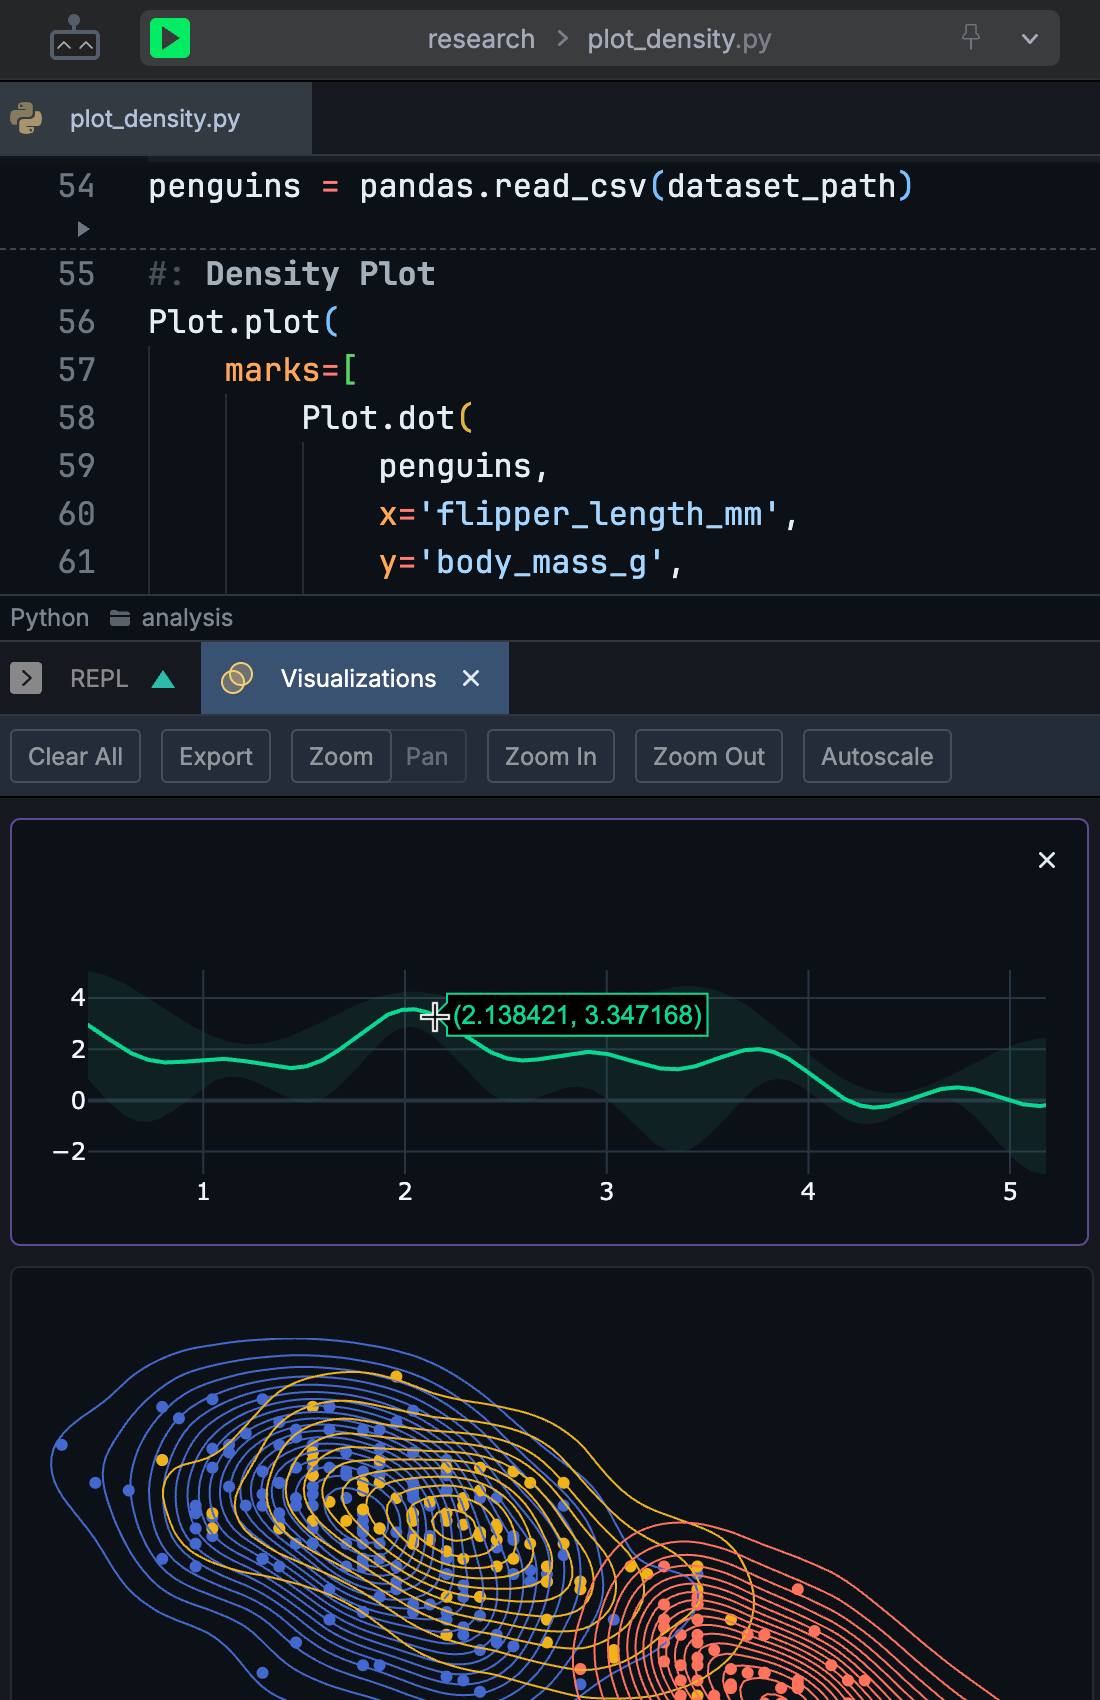
Works with built-in interactive plotting toolkits (based on Observable Plot and Plotly) as well as existing popular libraries like Matplotlib, Seaborn, and PIL.
Visualize in Realtime from Anywhere in Your Code
Dynamic visualizations are as simple as a loop:
Code Sections for Interactive Execution
Use #: comments to create code sections within your script that can be selectively executed, similar to notebook cells:
A Powerful REPL
Scripton includes a special Python REPL that's designed to be a natural extension of your coding environment.
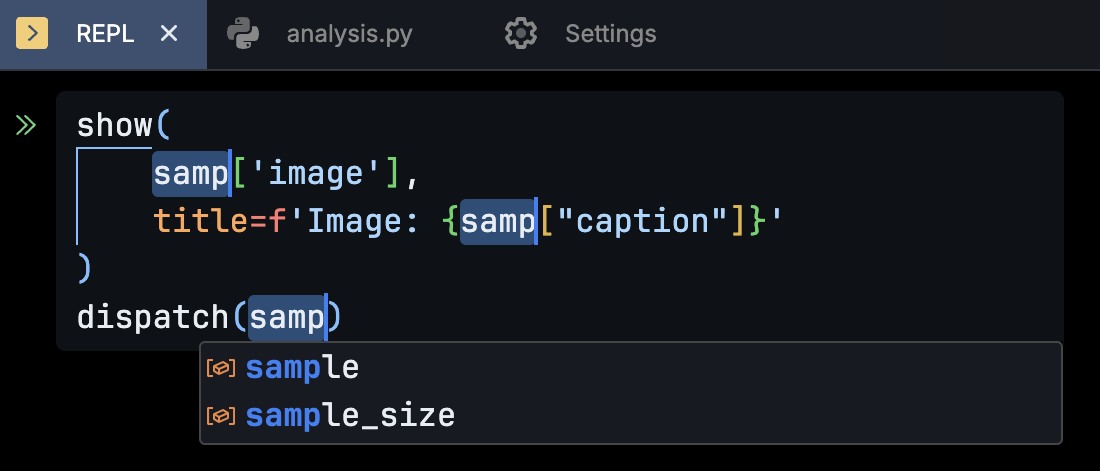
The REPL input is essentially a mini-editor with features like multiple cursors and auto-completion:
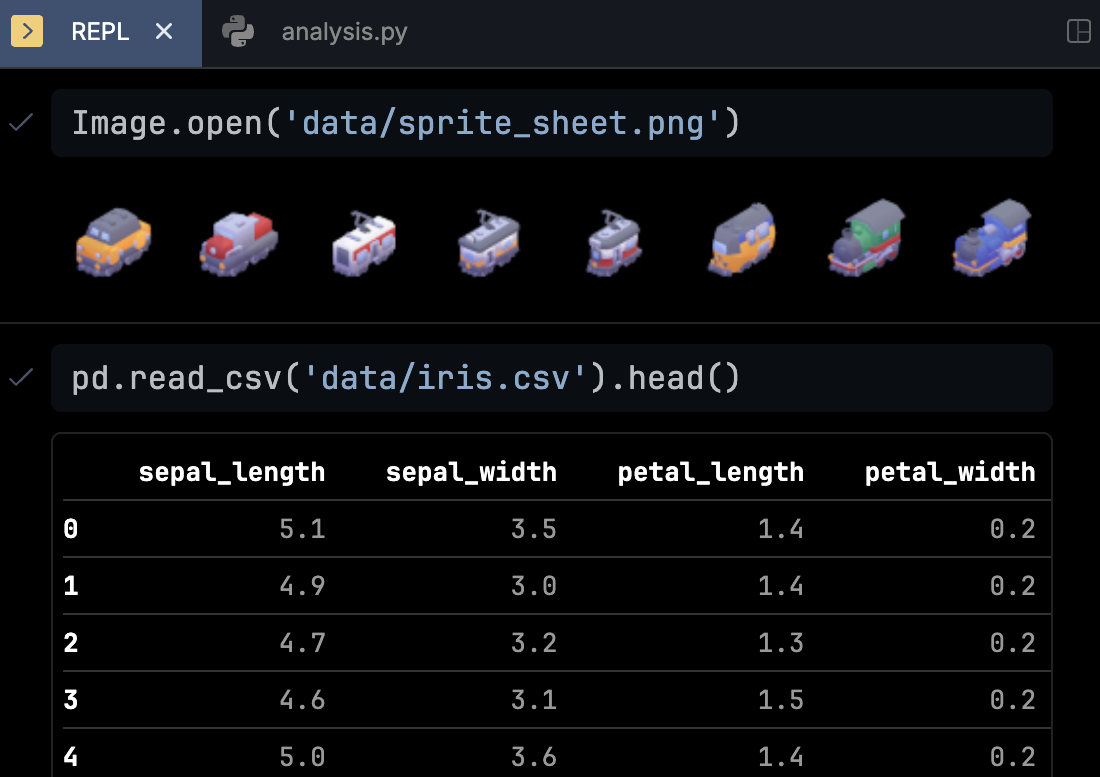
It can display rich outputs like images and tables:
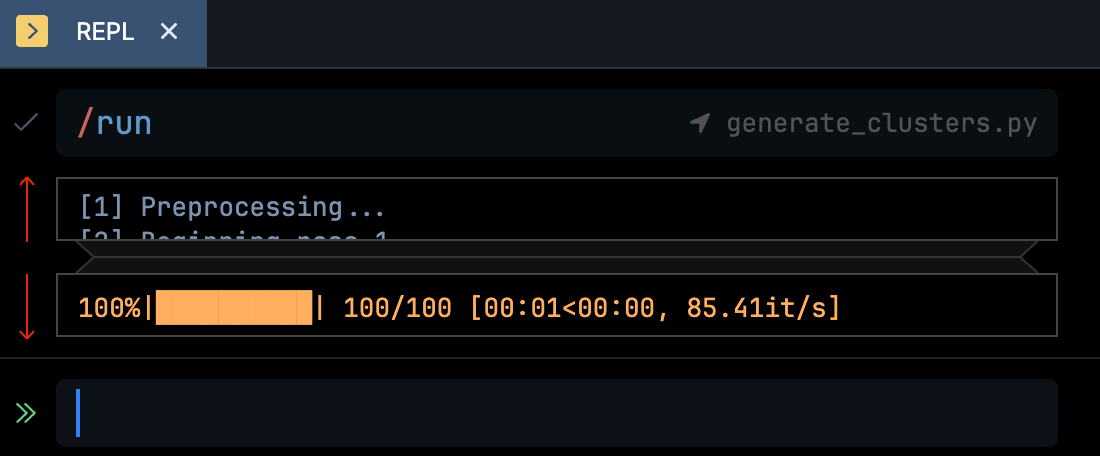
Long outputs can be folded (with live previews):
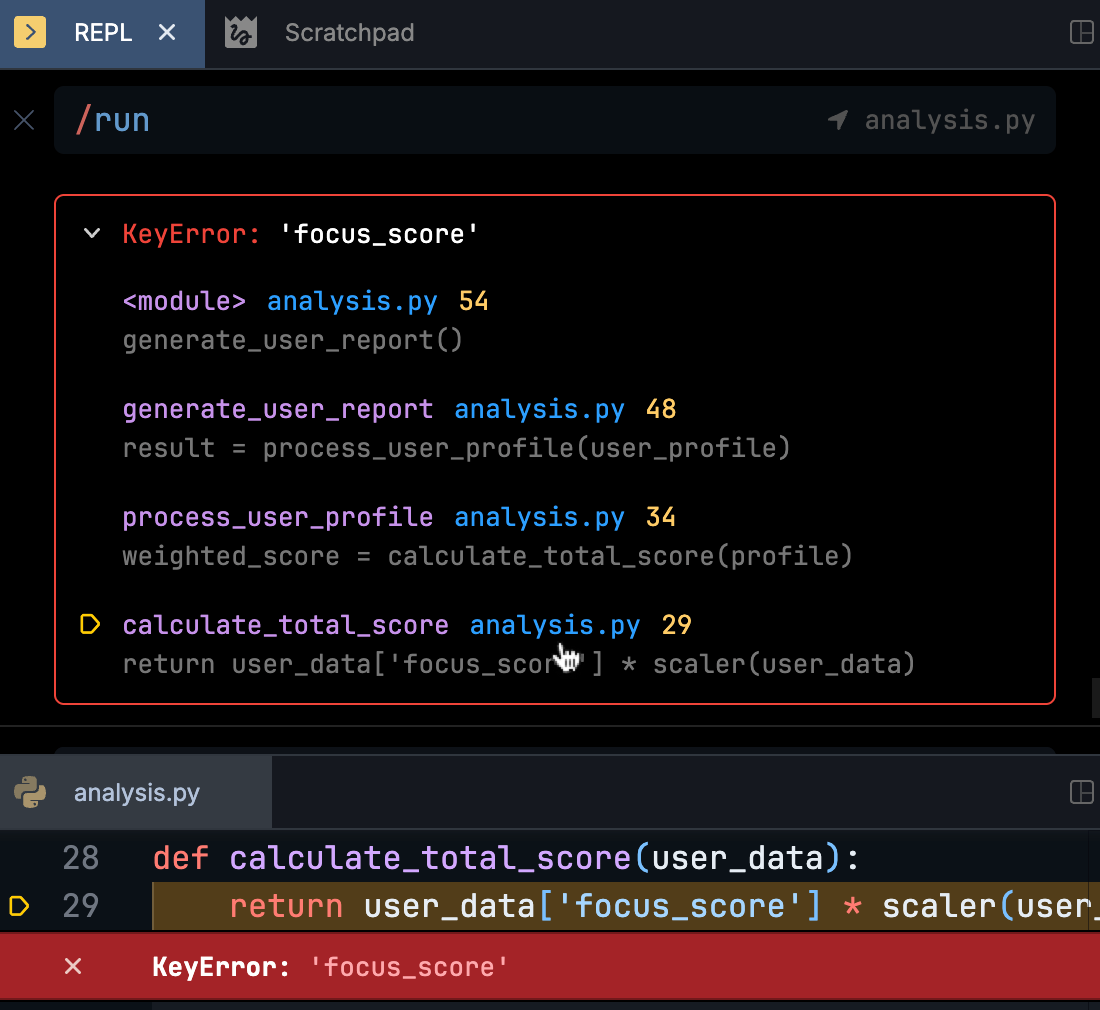
Exceptions are interactive with clickable traces:
A Delightful Debugger
Scripton includes a custom Python debugger designed to be unobtrusive yet powerful, helping you investigate issues faster and analyze code more effectively.
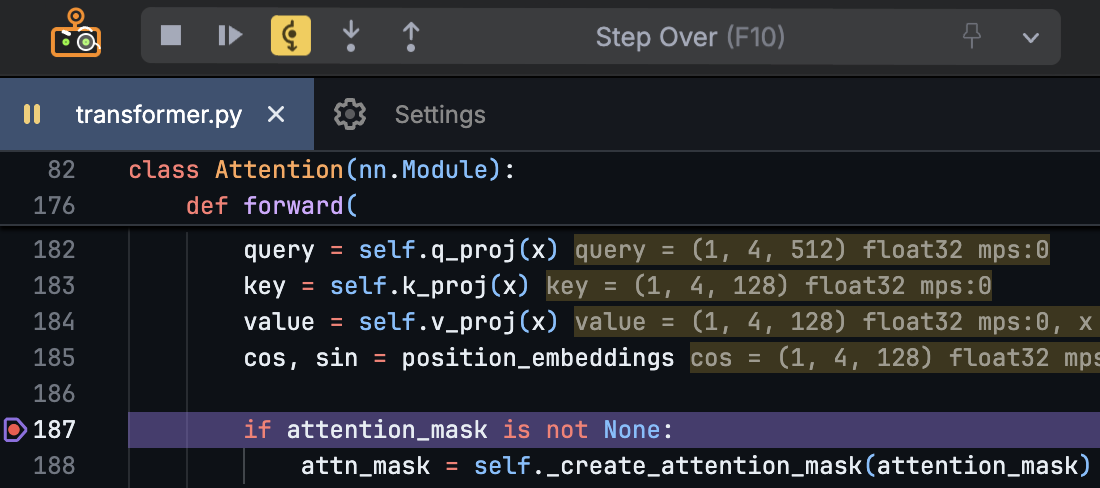
It shows helpful details about objects inline, with special support for popular libraries like NumPy and PyTorch:
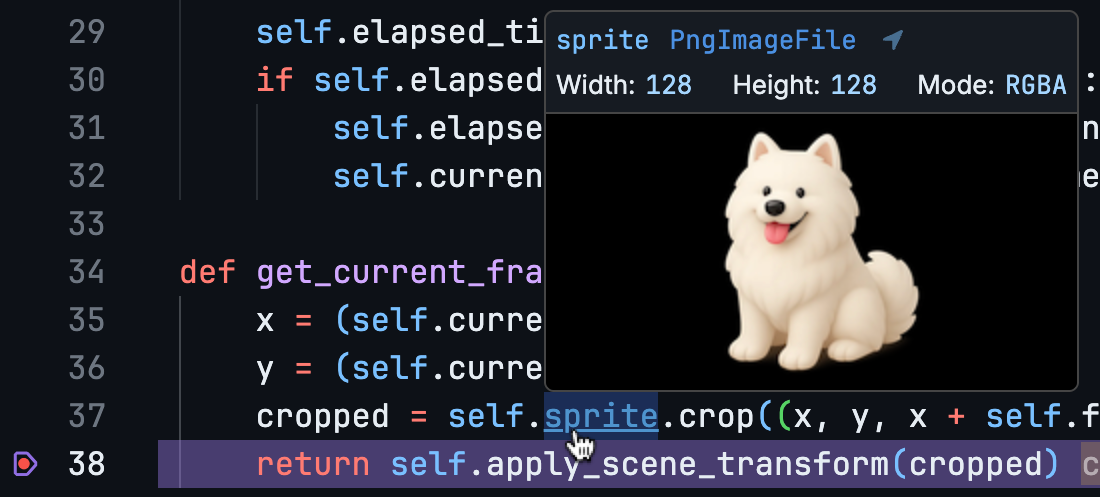
Hover over expressions for an instant preview:
View your variables in the Symbol Explorer:
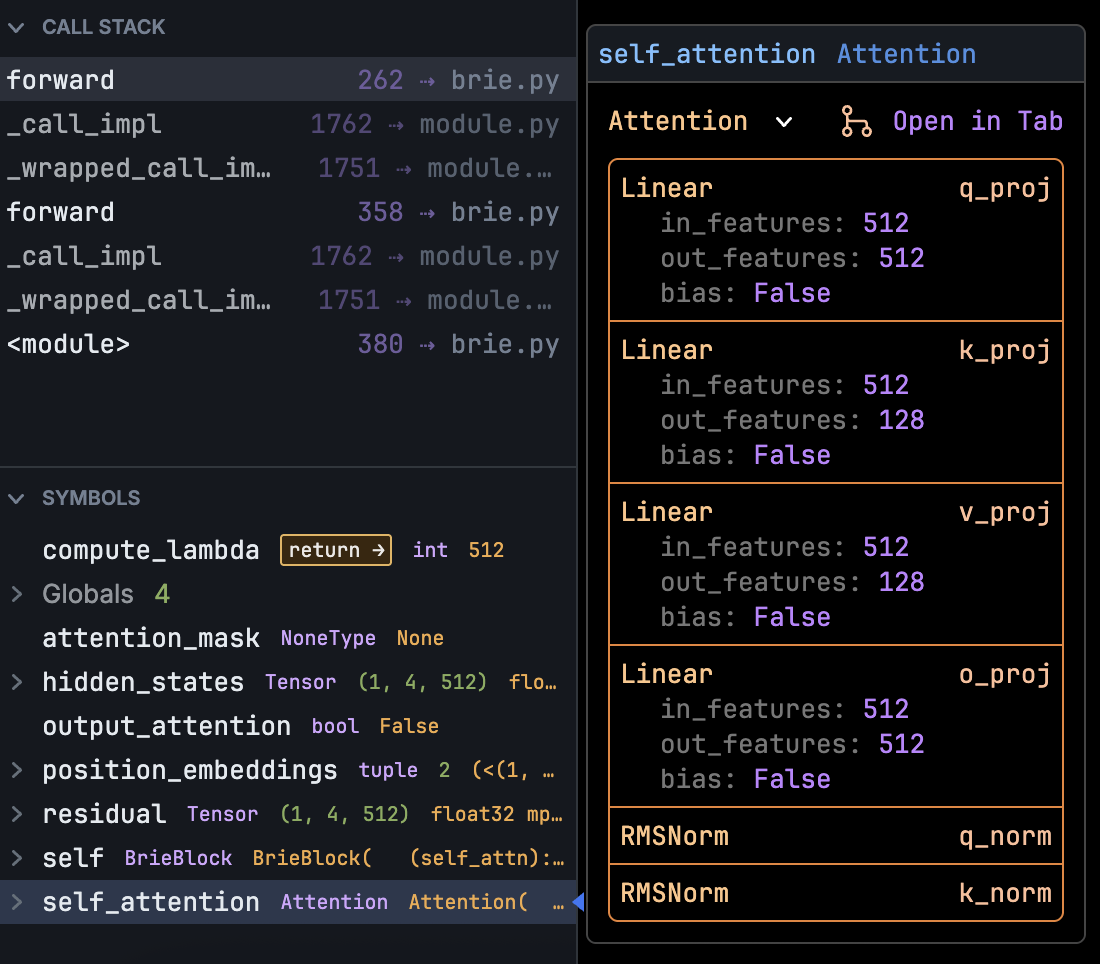
Use the REPL and all its features while paused in the debugger:

Make Interactive Interfaces
Scripton's built-in UI library allows you to easily create interactive scripts using plain Python.
GitHub Copilot AI
GitHub Copilot support is built into Scripton. You can use your existing GitHub Copilot subscription (including the free plan) to enable the AI features described below.
Pair it with Scripton's REPL and visualization tools to rapidly test, iterate, and refine the generated code.
Chat with AI directly in your IDE, include workspace files as context, and run examples with one click.
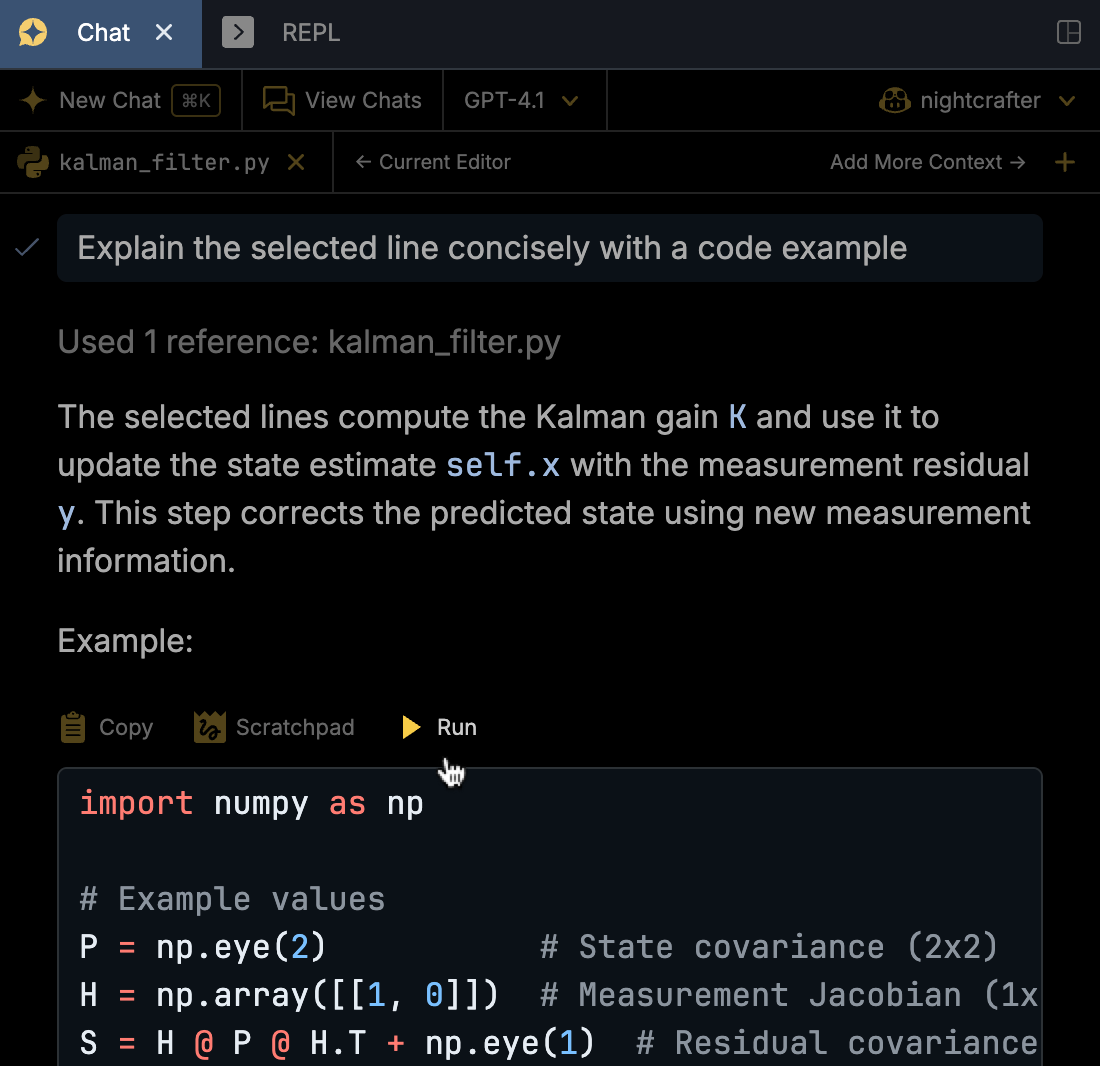
AI auto-completion works in both editors and the REPL, with the REPL automatically utilizing recent inputs and variables for context.

Built-in Python Toolkits
Scripton comes with powerful built-in libraries. No need to pip install anything — they're automatically available when using Scripton.
The plotting toolkits deeply integrate the Plotly and Observable Plot libraries into the IDE.
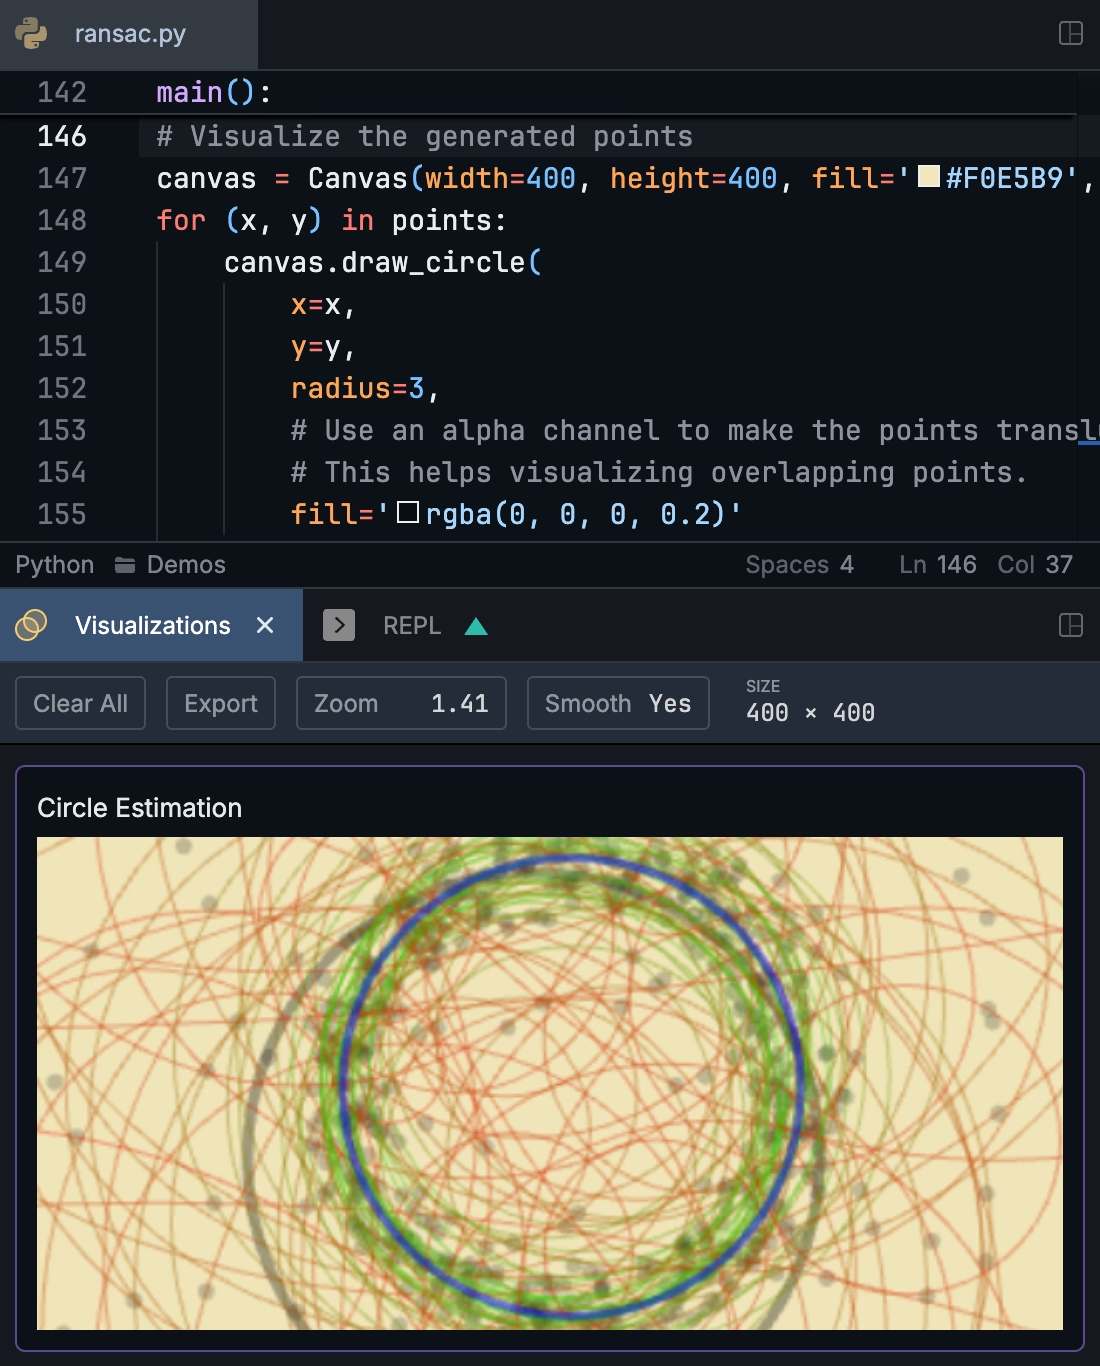
The Canvas toolkit provides a fast and powerful graphics library:
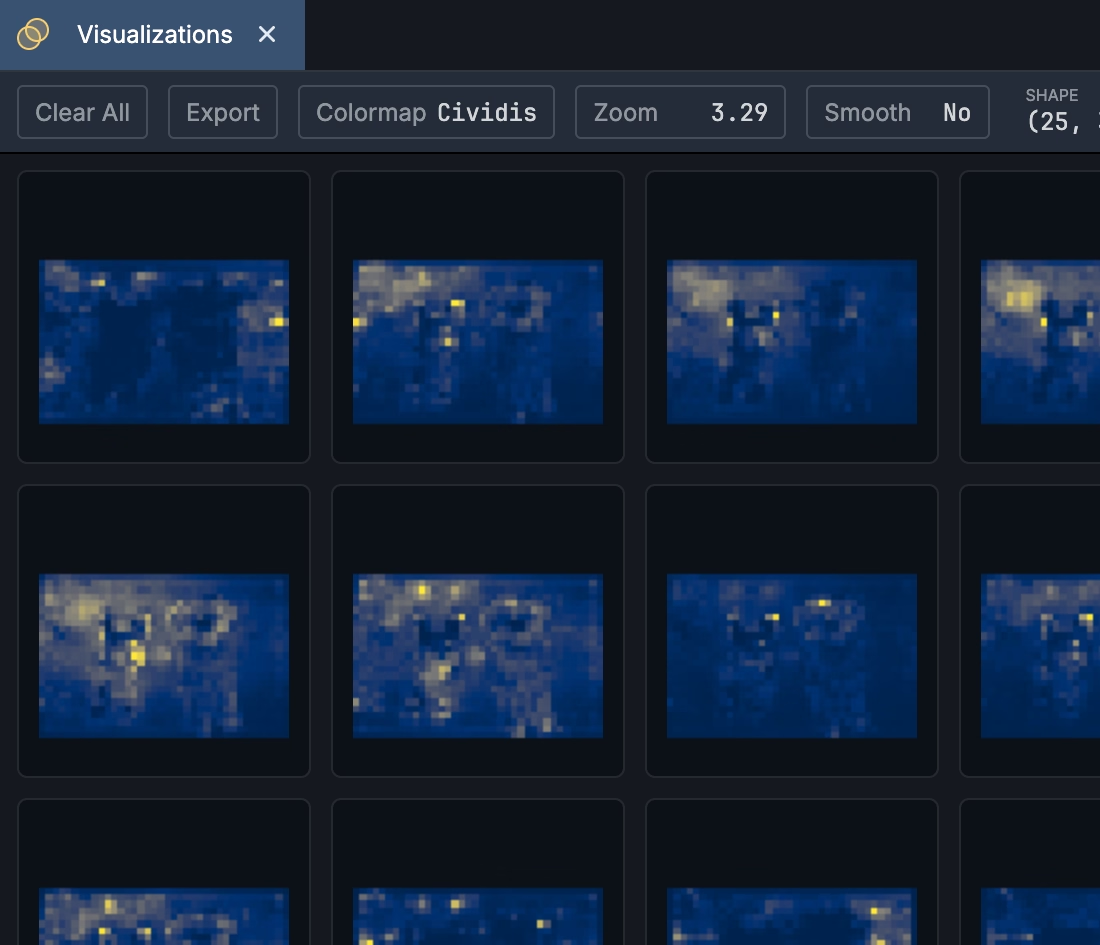
The handy show function can visualize images, tensor slices, and matrices:
The wait function allows quick and simple interactivity based on key presses:
Realtime Visualizations for Science & Engineering
Scripton's architecture combines high-performance interprocess communication for low latency and high throughput on the backend, while leveraging GPU-accelerated rendering to deliver real-time visualizations.
Watch how to Visualize Attention in a Detection Transformer using Scripton:
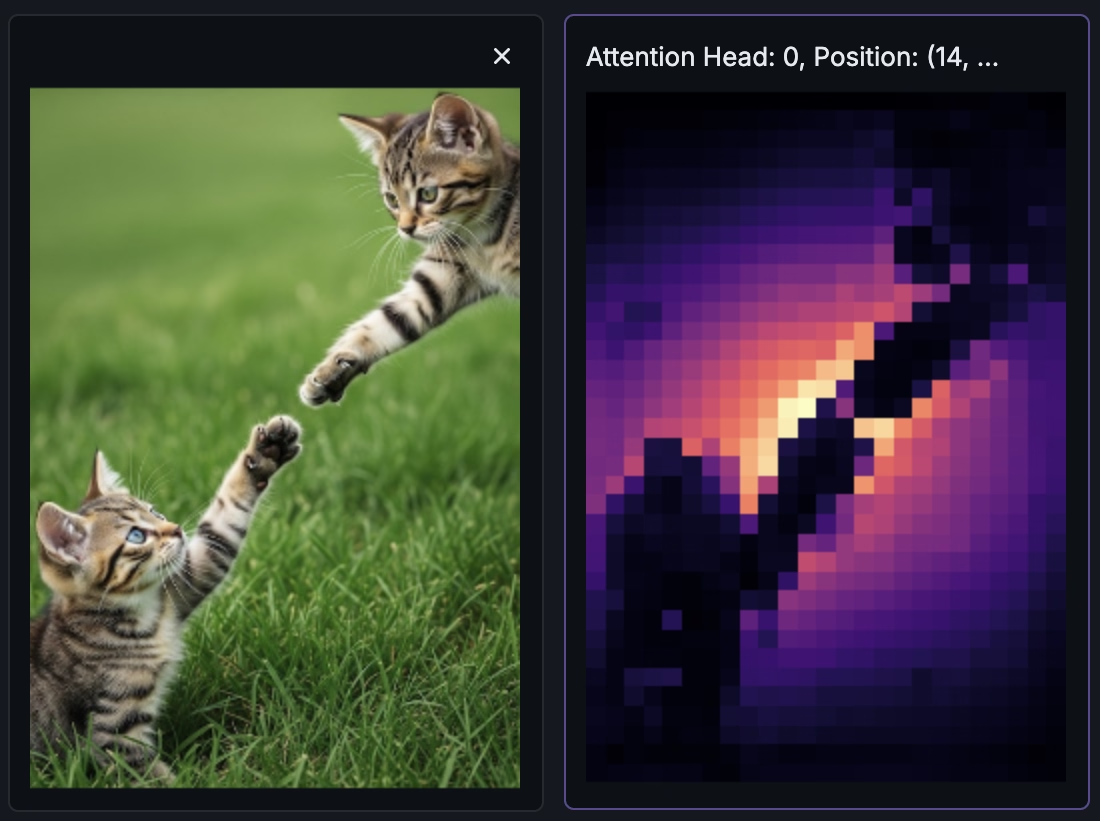
For Serious Work and Fun Explorations
Scripton is designed and engineered to serve a wide range of needs, from research and industrial applications to creative explorations.
System Requirements
Scripton currently requires macOS. Windows and Linux support is planned.
Python 3.8 or newer is required. Scripton supports a wide range of existing Python environment managers.
Contact
Email us at contact@scripton.dev or Join us on Discord.